
BI dashboards
Live dashboards for sales, finance and operations.
Dashboards, reports and forecasts that show what’s working across sales, marketing and operations, updated automatically.
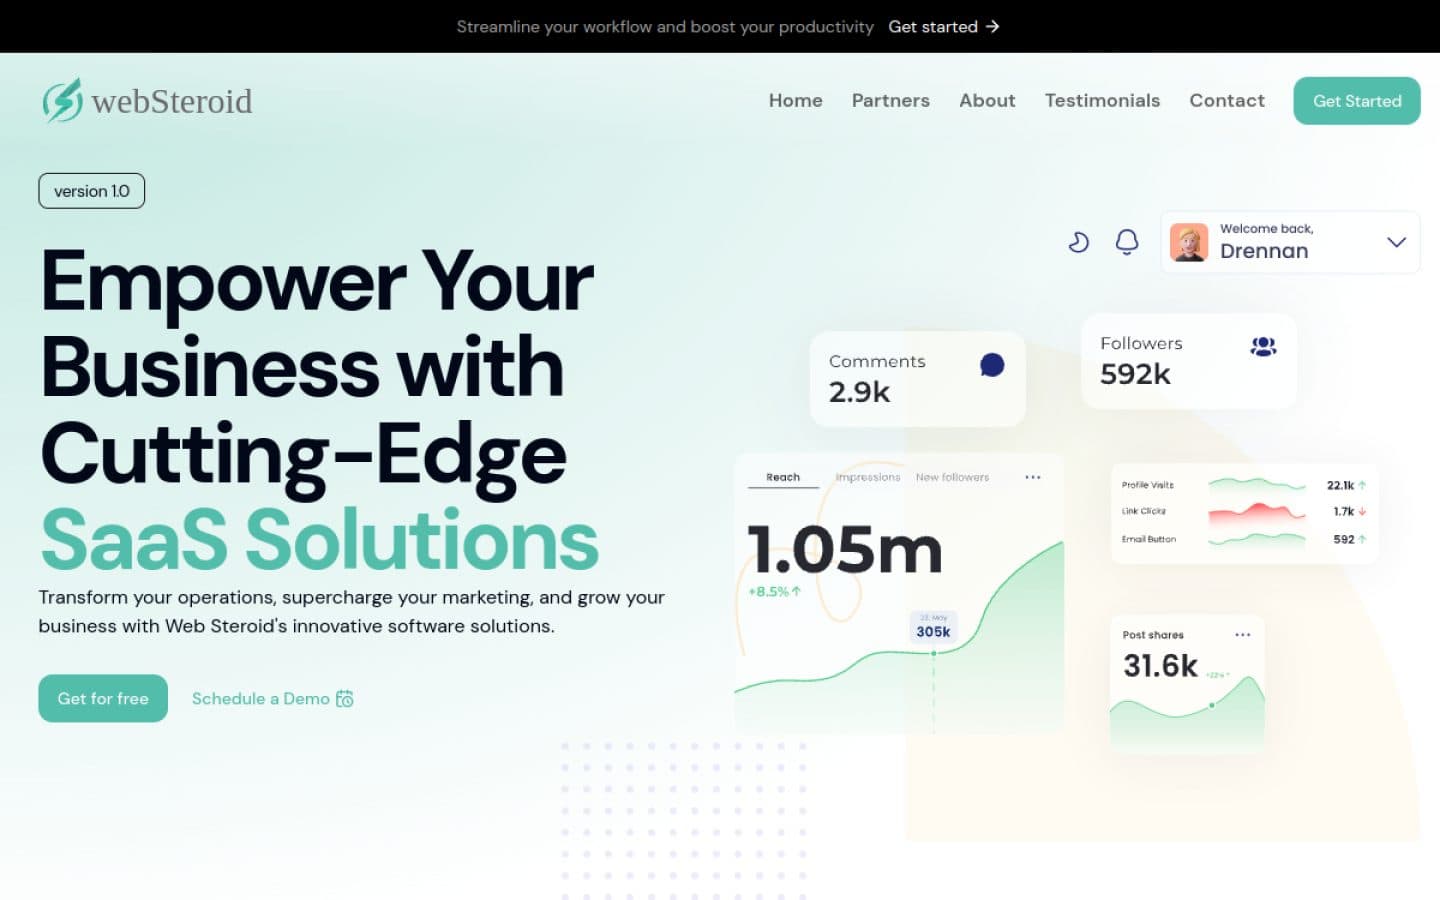
Live dashboards for sales, finance and operations.
Pull data from your apps, sheets and databases into one place.
Know which channels and campaigns drive revenue.
Predict demand, cash flow and stock needs.
Automated weekly and monthly reports by email.
Advice on what to track and how to structure it.
Every project includes a dedicated project lead, weekly progress updates, a live preview link and post-launch support.
Agreed in writing before work starts.
Progress reports and a live preview link.
Code, data, accounts and IP are yours.
Training, fixes and improvements on call.
Free consultation to understand your goals, users and budget.
Scope, timeline, milestones and a fixed quote in 24 hours.
Wireframes and interactive prototypes you approve before build.
Agile sprints with a live preview link at every milestone.
Manual and automated testing across devices and networks.
Go live, Google listing, team training and ongoing care.
No. Most businesses start with sales, website and spreadsheet data and grow from there.
Yes. We connect your sources so dashboards refresh on a schedule or in real time.
You control access by user and role, on desktop and mobile.
Fixed-price projects are paid in milestones. Ongoing work is billed monthly.
Share your idea and get a clear plan, timeline and quote within 24 hours.